#99 closed defect (fixed)
most recent curves don't always plot on top in apps
| Reported by: | Kevin Milner | Owned by: | Kevin Milner |
|---|---|---|---|
| Priority: | major | Milestone: | OpenSHA 1.1 |
| Component: | sha | Version: | |
| Keywords: | Cc: |
Description
In reproducing figures from hazard curve tutorials, I noticed that curves that are added later in the calculation are not necessarily on top. For the tutorial, the grey curves should be on bottom, blue fractiles above that, and red mean curve on top.
Attachments (2)
Change History (8)
comment:1 Changed 14 years ago by
comment:2 Changed 14 years ago by
or we just simply could enforce that the most recent is always on top, oldest always on bottom. maybe plot prefs could have up/down buttons for switching the order.
comment:4 Changed 14 years ago by
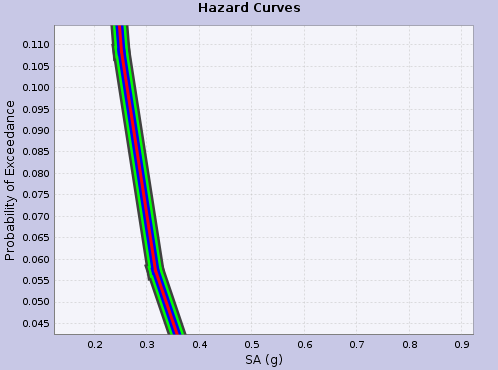
It looks like it's currently done in reverse order. The first curve is always on top, last curve always on bottom. I think this should be flipped. See the file I just attached:

In this example, here's the calculation order:
- Red - shown on top
- Blue
- Green
- Brown (or whatever that color is) - shown on bottom
I'm going to reverse that now, unless anyone objects
Changed 14 years ago by
| Attachment: | curves_order_fixed.png added |
|---|
comment:5 Changed 14 years ago by
| Resolution: | → fixed |
|---|---|
| Status: | new → closed |
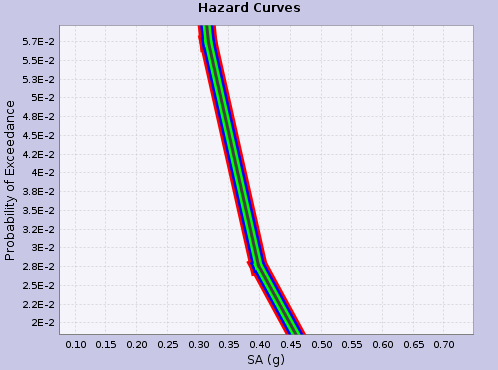
done in [7293]...pretty simple fix actually. Just had to call plot.setDatasetRenderingOrder(DatasetRenderingOrder?.FORWARD);
Now a plot, calculated in the same order, appears as such:

Notice that the first curve (red) is now on bottom.
I always been annoyed by this (seems like the one you want to see is always underneath, but then again, you only notice the problem when it is a problem). Seems like the best would be to allow the user to change the ordering.