Opened 10 years ago
Closed 10 years ago
#460 closed enhancement (fixed)
Better plotting options for min/max and confidence intervals
| Reported by: | Kevin Milner | Owned by: | Kevin Milner |
|---|---|---|---|
| Priority: | major | Milestone: | |
| Component: | commons | Version: | |
| Keywords: | Cc: |
Description
Add capability to plot shaded confidence intervals or min/max for a function.
Attachments (1)
Change History (2)
comment:1 Changed 10 years ago by
| Resolution: | → fixed |
|---|---|
| Status: | new → closed |
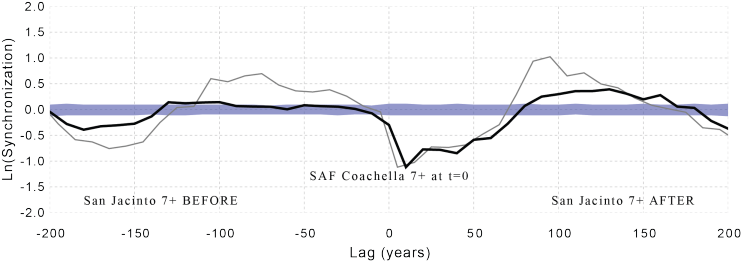
Done in [10660], see example image below. In order to use it, you must first create a new UncertainArbDiscDataset? and use PlotLineType?.SHADED_UNCERTAIN or PlotLineType?.SHADED_UNCERTAIN_TRANS, the latter of which has a default 50% transparency. Nothing will be plotted for other function types, and it is not compatible with symbols.

Note: See
TracTickets for help on using
tickets.